2 minutes
The Million Dollars Grid
I am not a financial expert (far from it). I am a normal man, mystified by the magic of compounding interest.
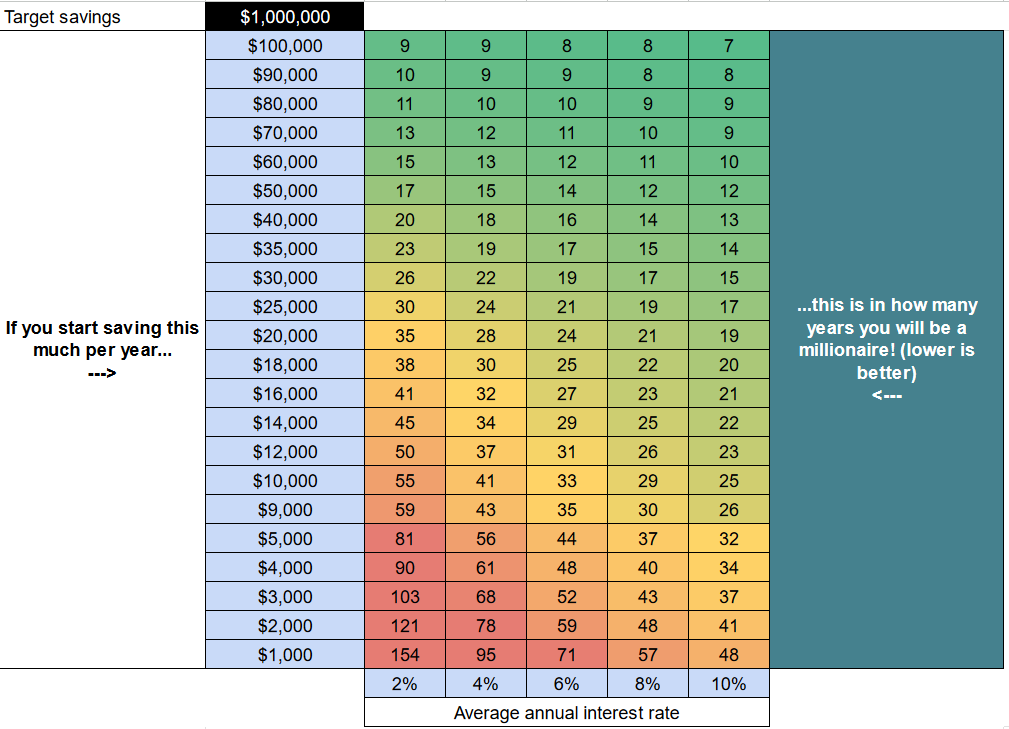
Here’s an interesting question: how long does it take to become a millionaire? That’s a tricky thing to evaluate, given the magic properties of compounding interest. Indeed, you might become a millionaire sooner than you think (just like Scotia Bank’s slogan says). This question can be divded in three sub-questions:
- At what age have you started investing?
- How much money can you reliably save per year?
- How much averaged annual interest are you realistically hoping for?
- Personally, I’m hoping for 6%, but I use 2% in my models as a margin of safety.
With the answer to these questions in hand, all you have to do is find your answer in this chart:
This is not financial advice.
Please be careful when making long term predictions. Should your current reality change, your spendings might also change and impact your ability to invest.
In order to create this chart in Google Sheets, I had to learn about the NPER function, which calculates the number of payment periods for an investment based on constant-amount periodic payments and a constant interest rate. I had no idea that financial functions like this one where already implemented in the program: neat! It solved me the big headache of having to figure out how to program my cells to achieve the same result!
The idea for this visualization was heavily inspired (if not directly lifted from) The Million Dollar Grid - Four Pillar Freedom.